
Products
Genability Adds Support for PVWatts Version 6
By Ruben Garcia
| Reading time 4 minutes
We’ve added support for Version 6 of NREL’s PVWatts API, used to estimate the hourly production of a customer’s solar PV system.
What’s new in V6?
The underlying models used to calculate energy output have not changed from Version 5 but Version 6 includes broader and more granular weather and solar radiation data from NREL’s National Solar Radiation Database (NSRDB).
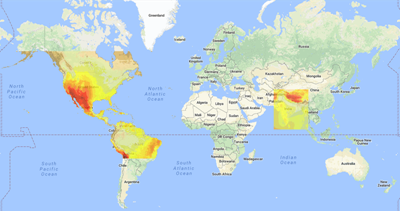
The NSRDB dataset includes climate data for the Americas between 20° S and 60° N (including Hawaii), as well as the Indian subcontinent and parts of Central Asia, as indicated on the map.
Within the coverage areas, solar and weather data are now available for each 4 km x 4 km land area (AKA “gridded data”). This means Version 6 offers production results for about 2 million different locations, versus only 239 TMY2 stations and 1,020 TMY3 stations. The bottom line is you can now model solar production in places you previously couldn’t (like most of Canada, all of Mexico, and the northern half of South America) and production results will be for an area much closer and more suitable to your site location.
You can still opt for any of the older climate datasets (TMY2, TMY3, or International) but you have to explicitly override the NSRDB dataset, which is the default in Version 6. To continue using the same climate data as in Version 5, you should pass the climateDataset parameter as tmy2 in your PVWatts API calls.
Version 6 also includes a change in the default DC to AC ratio from 1.1 to 1.2. To continue using the Version 5 default (1.1) or a different value, you should explicitly pass the DCACRatio parameter and desired value in your API calls.
V6 Production Comparisons
Curious how system production output changed in Version 6? So were we, so we ran a few tests. The table below compares annual production output between Versions 5 and 6 in top solar markets, assuming identical system design parameters, except the two new defaults in Version 6 (NSRDB dataset and a DC to AC ratio of 1.2).
The first seven locations (San Francisco to Santa Cruz) roughly cover the SF Bay Area. Version 5 returned identical energy production for all seven locations (all use the closest TMY2 station data from SF International Airport). Version 6 results varied for each location, demonstrating the more granular data available in the NSRDB dataset.
Across the 26 U.S. locations we tested, Version 6 returned 2.6% higher annual production than Version 5, on average. Version 6 showed the largest positive difference in Miami (+7.5%) and negative difference in Daly City (-3.4%). Daly City is one of the foggiest places in the Bay Area and the NSRDB dataset seems to better reflect its microclimate than the TMY2 station at SFO Airport, which is more inland and sees more sunshine.
| Location | Zip Code | V5 (kWh) | V6 (kWh) | V6 Change |
|---|---|---|---|---|
| San Francisco, CA | 94105 | 7,788 | 7,801 | 0.2% |
| Daly City, CA | 94014 | 7,788 | 7,523 | -3.4% |
| San Rafael, CA | 94901 | 7,788 | 7,882 | 1.2% |
| Oakland, CA | 94609 | 7,788 | 7,712 | -1.0% |
| Concord, CA | 94518 | 7,788 | 8,029 | 3.1% |
| San Jose, CA | 95126 | 7,788 | 8,086 | 3.8% |
| Santa Cruz, CA | 95060 | 7,788 | 7,847 | 0.8% |
| Los Angeles, CA | 90001 | 7,910 | 8,259 | 4.4% |
| San Diego, CA | 92101 | 8,039 | 7,868 | -2.1% |
| Las Vegas, NV | 88901 | 8,801 | 8,578 | -2.5% |
| Reno, NV | 89501 | 8,159 | 8,263 | 1.3% |
| Phoenix, AZ | 85001 | 8,605 | 8,496 | -1.3% |
| Salt Lake City, UT | 84101 | 7,488 | 7,319 | -2.3% |
| Denver, CO | 80014 | 7,696 | 8,111 | 5.4% |
| Albuquerque, NM | 87101 | 8,917 | 8,778 | -1.6% |
| Austin, TX | 73301 | 7,369 | 7,330 | -0.5% |
| Miami, FL | 33101 | 7,257 | 7,799 | 7.5% |
| Charleston, SC | 29401 | 7,206 | 7,198 | -0.1% |
| Charlotte, NC | 28105 | 7,099 | 7,014 | -1.2% |
| Baltimore, MD | 21201 | 6,644 | 6,879 | 3.5% |
| New York, NY | 10001 | 6,410 | 6,585 | 2.7% |
| Brooklyn, NY | 11203 | 6,611 | 6,889 | 4.2% |
| Newark, NJ | 07101 | 6,410 | 6,624 | 3.3% |
| Boston, MA | 02112 | 6,664 | 6,531 | -2.0% |
| Hartford, CT | 06101 | 6,259 | 6,423 | 2.6% |
| Chicago, IL | 60007 | 6,420 | 6,884 | 7.2% |
Your Integration with Genability
If you are currently integrated to use Version 5 of Genability’s PVWatts API, nothing has changed on the Genability end. However, NREL has announced that Version 5 will be shut down at the end of December 2018. To avoid disruptions in service, users should switch to Version 6 before then.
To switch to Version 6, simply update the sourceVersion parameter value to 6 in your Genability PVWatts API calls. The sourceVersion parameter is optional and when not included we default it to 6. If you want to switch to Version 6 but would like to continue receiving the same production results you were seeing in Version 5, pass the sourceVersion as 6, climateDataset as tmy2, and DCACRatio as 1.1. Here’s our PVWatts API documentation and some helpful examples. With Version 5 going away on 1/1/2019, now’s the time to make the transition to Version 6. If you have any questions don’t hesitate to email support@genability.com.

Also in Products
Explorer Web App for Energy Professionals
By Jason Riley | Aug 1, 2018
Today we are pleased to announce the launch of our latest product, Genability Explorer, a web-application for Energy Professionals.
Estimating Energy Usage from Customer’s Bill Amount
By Jenny Trinh | Dec 5, 2017
Do you have a potential solar customer’s 12 months of bills or their annual bill amount for electricity? If so, we can now estimate energy usage from that information!
Run Down of Genability Developer Website Updates
By Charity Vargas | Nov 10, 2017
A quick rundown of the latest and greatest updates on GDN, our developer website.
Genability has Electricity Rates for the Netherlands
By Ruben Garcia | Sep 1, 2017
We’re pleased to announce that we’ve added Dutch residential utility rates to our database! Our list of covered countries now includes the US, Canada, Mexico, Australia, South Korea, UK, France and the Netherlands.